freeCodeCamp project Mean-Variance-Standard Deviation Calculator
To earn the freeCodeCamp certification on Data Analysis with Python, one has to complete five projects. This post goes through the details for the first one named Mean-Variance-Standard Deviation Calculator.


![]()

freeCodeCamp is a website where one can learn coding for free. Once you log in, you'll have free access to more than 8,000 tutorials 😇. What I like best about it is that you can earn free certifications by completing courses on various topics. These courses are pretty intense, and it'll take you at least 300 hours to finish any of them. For instance, I started Data Analysis with Python, Scientific Computing with Python, and Machine Learning with Python back in 2020, but didn't actually get any of them done until recently.
The major challenge is that all these courses involve some coding projects, which require much more time and attention than just watch tutorial videos and do multiple-choice quizzes. But I finally nailed Data Analysis with Python and earned this certification 🙌!

This particular course covers the following five projects:
- Mean-Variance-Standard Deviation Calculator
- Demographic Data Analyzer
- Medical Data Visualizer
- Page View Time Series Visualizer
- Sea Level Predictor
The tools you'll be using are numpy and pandas for data wrangling and matplotlib and seaborn for visualization. I've learned a lot By working on these projects, which are really worth my time. So I plan to document the learning process and write a post on each of the projects.
I'm sure there are already some solutions somewhere on the internet, but I'll write down mine anyway and focus more on the thinking process than final codes. The only help I turned to was official documentations of Python libraries and some snippets on stackoverFlow.
With that, let's start with Mean-Variance-Standard Deviation Calculator, which is the easiest one of the five.
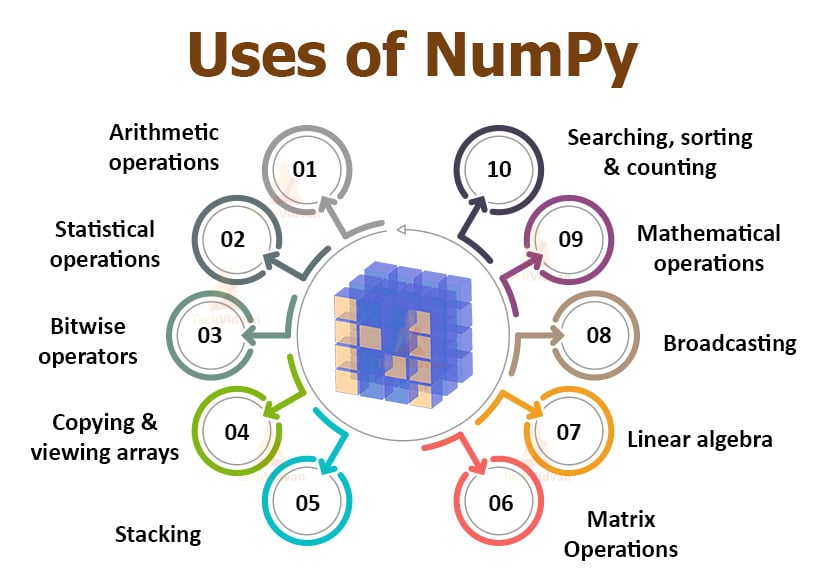
For this project, we need nothing but the numpy library, which is preinstalled on Colab. This graph that I found on techvidvan.com nicely summarizes 10 common uses of numpy.
import numpy as np
Let's first clone the project repo and change the current directory to boilerplate-mean-variance-standard-deviation-calculator, where the README.md file contains the task instructions.
!git clone https://github.com/freeCodeCamp/boilerplate-mean-variance-standard-deviation-calculator
%cd boilerplate-mean-variance-standard-deviation-calculator
readme = !cat README.md
print(readme)
But the plain text isn't pretty and hard to read. So I'll use the rich library to make it look rich 💰.
!pip install rich
Now with the helper function show_readme, we can render the instructions in a beautiful format.
from rich.console import Console
from rich.markdown import Markdown

def show_readme():
    console = Console()
    with open("README.md") as readme:
        markdown = Markdown(readme.read())
    console.print(markdown)
Here's original text for the assignment.
show_readme()
Here're the steps that I'm gonna go through:
- I'll create a variable named
matrix, which holds 9 numbers in a 3x3 matrix. - I'll calculate the values for summation on the matrix to see if everything works as expected.
- I'll wrap the calculating process in a general function named
get_results.
One of the easiest ways to create a matrix is to call the np.array function with a list of numbers, which is turned into a NumPy one-dimentional array. Then you just call the reshape method on it to make it two-dimentional.
input = [num for num in range(9)]
arr = np.array(input)
matrix = arr.reshape(3, 3)
print(f"arr:\n{arr}")
print(f"matrix:\n{matrix}")
To get the sum of all the numbers in matrix, just call the sum method on it.
flattened_sum = matrix.sum()
flattened_sum
That was easy, but what comes next can be confusing. We're supposed to do summation along two axes, so let's first figure out whether axis1 contains results calcuated along columns or rows. It turns out that we'll get the sum of all the numbers along a column when we call the sum method on matrix with the axis argument specified as 0 and along a row when the axis value is 1.
axis1_sum = matrix.sum(axis=0)
axis2_sum = matrix.sum(axis=1)
print(f"axis1_sum: \n{axis1_sum}")
print(f"axis2_sum: \n{axis2_sum}")
The following graph illustrates the idea better than what I just said.

Notice that axis1_sum is a NumPy array, but we're supposed to return it as a list. So we call the tolist method on axis1_sum to do the conversion.
old_type = type(axis1_sum)
axis1_sum = axis1_sum.tolist()
new_type = type(axis1_sum)
print(f"Old type: {old_type}")
print(f"New type: {new_type}")
Now that we've figured out how to get the values of axis1, axis2, and flattened for summation, we can just repeat the same process for the other 5 mathematical operations. So let's wrap the calculating process in a general function called get_results. It takes two arguments, one being op for the name of the mathematical operation to be done, and the other matrix. Luckily 😀, the numpy API is quite consistent across the 6 operations, so for each mathematical operation we just need to change the method name accordingly.
def get_results(op, matrix):
    if op == "sum":
        axis1 = matrix.sum(axis=0).tolist()
        axis2 = matrix.sum(axis=1).tolist()
        flattened = matrix.sum()
    elif op == "min":
        axis1 = matrix.min(axis=0).tolist()
        axis2 = matrix.min(axis=1).tolist()
        flattened = matrix.min()
    elif op == "max":
        axis1 = matrix.max(axis=0).tolist()
        axis2 = matrix.max(axis=1).tolist()
        flattened = matrix.max()
    elif op == "std":
        axis1 = matrix.std(axis=0).tolist()
        axis2 = matrix.std(axis=1).tolist()
        flattened = matrix.std()
    elif op == "var":
        axis1 = matrix.var(axis=0).tolist()
        axis2 = matrix.var(axis=1).tolist()
        flattened = matrix.var()
    elif op == "mean":
        axis1 = matrix.mean(axis=0).tolist()
        axis2 = matrix.mean(axis=1).tolist()
        flattened = matrix.mean()
    return [axis1, axis2, flattened]
Now let's test the function with sum and var, for the sum and variance respectively.
get_results("sum", matrix)
get_results("var", matrix)
The last thing that needs to be taken care of is error handling. We just need to raise ValueError with a specific message when the length of the input list is not 9.
def calculate(mylist):
    if len(mylist) != 9:
        raise ValueError("List must contain nine numbers.")
    else:
        pass
mylist = [1, 2, 3]
calculate(mylist)
Finally, our final codes should be saved as mean_var_std.py and look like this:
import numpy as np

def get_results(op, matrix):
    if op == "sum":
        axis1 = matrix.sum(axis=0).tolist()
        axis2 = matrix.sum(axis=1).tolist()
        flattened = matrix.sum()
    elif op == "min":
        axis1 = matrix.min(axis=0).tolist()
        axis2 = matrix.min(axis=1).tolist()
        flattened = matrix.min()
    elif op == "max":
        axis1 = matrix.max(axis=0).tolist()
        axis2 = matrix.max(axis=1).tolist()
        flattened = matrix.max()
    elif op == "std":
        axis1 = matrix.std(axis=0).tolist()
        axis2 = matrix.std(axis=1).tolist()
        flattened = matrix.std()
    elif op == "var":
        axis1 = matrix.var(axis=0).tolist()
        axis2 = matrix.var(axis=1).tolist()
        flattened = matrix.var()
    elif op == "mean":
        axis1 = matrix.mean(axis=0).tolist()
        axis2 = matrix.mean(axis=1).tolist()
        flattened = matrix.mean()
    return [axis1, axis2, flattened]

def calculate(mylist):
    if len(mylist) != 9:
        raise ValueError("List must contain nine numbers.")

    else:
        matrix = np.array(mylist).reshape(3, 3)
        calculations = {
                        'mean': get_results('mean', matrix),
                        'variance': get_results('var', matrix),
                        'standard deviation': get_results('std', matrix),
                        'max': get_results('max', matrix),
                        'min': get_results('min', matrix),
                        'sum': get_results('sum', matrix),
                        }

    return calculations
Let's test the calculate function to ensure it works just as expected. And it did 🙌!
input = [0,1,2,3,4,5,6,7,8]
calculate(input)
After you finish the freeCodeCamp project Mean-Variance-Standard Deviation Calculator, you'll be able to do some basic math using the numpy library. This first project is really just a warm-up, and it gets more challenging as we move on to the other four, which I'll blog (definitely not brag) about soon 👼.